Regenerative medicine

The cell culturing process requires tremendous time and labour with repetitive tasks. The client’s current digital platform lacked intuition, creating extra effort, and decreased scientists efforts to reproduce experiments in a reliable manner.

The project team and I were asked to understand current pain-points and opportunities, to improve the solution’s user experience, so that research scientists can manage and convey experimental data. The digital platform needed to put reproducibility and credibility at the heart of scientific research. The client needed an intuitive user experience and interface for their second proof of concept launching in October 2021.  

The Client

The client is a major Japanese organisation better known internationally for their retail camera products. This project will focus more on their smart IoT cell culturing and microscopic devices that connects to a dashboard where the data is transferred  through the network for further processing.

The Team

  • Project Lead
  • Senior UX designer (me)
  • Senior service designer
  • Translator
This project was a collaboration between the Australian and Japanese Desginit agencies. The project team consisted of:
The project team and the client worked completely remotely, given the locations of everyone involved, as well as the pandemic forcing the work from home situation in both Australia and Japan. We used tools like Microsoft Teams, Slack, Figma, and Miro to communicate and collaborate online. Translations were done by the project lead and the translator, translating in real time on post it notes in Miro.

The Journey

When scientists perform their experiments, they have several verticals that they work within to get to the stage of writing and publishing reports and research papers. That does not mean their work is linear, but these are the major themes within a project. Through discussions and workshops with the client, we collaboratively defined the opportunity areas that will be the focus of our project and will become the focus of our thinking and strategy when ideating on the future solution.

The Approach

We worked agile on this project, dividing the project up into sprints or "loops" as they are referred to in japan. Each loop had a high level description of the activities. During the project at the end of every week, we would reiterate the plan of the project, where we were up to, what was completed, and workshopping any outputs that required validation or feedback. This allowed us to align with the client, collaborate with them and help them to achieve their business objectives and vision for the product.

The Ecosystem

As stated earlier, the client were looking to optimise their ecosystem consisting of cell incubators, microscopes, and the central dashboard that is the repository of the data collected by the devices. The dashboard required flexibility to receive the data and allow the users to manage the data so they can note down any observations or discoveries, then later write reports where supervisors can access the reports and notes for feedback and approval.

IoT enabled devices

Smart laboratories

Research scientists

Digital platform

The client designed an incubation monitoring system to help support scientist’s during the cell culturing experiments. The system provides qualitative and qualitative results by storing cell culturing data.
Laboratories are smart facilities equipped with IoT experiment devices. The client is committed to designing devices to support the cell culturing process with the goal of commercialising them as products.
There are three user groups who interact with the clients’ devices. 60% of users are scientists who work in a research-centric labs. 30% of users are scientists who work in organisational labs. 10% are independent researchers.
The solution is a digital platform for science researches to manage and convey experimental data to improve the repeatability and credibility of experiments. It’s an interface use to plan, analyse, and communicate. 
The current solution did not provide users this functionality in a usable way (feedback from user testing participants described the difficulty and frustration they experienced interacting with the current version of the dashboard). The graphic below expresses the early impressions we had when diving into the first loop (discovery).

Define and Align

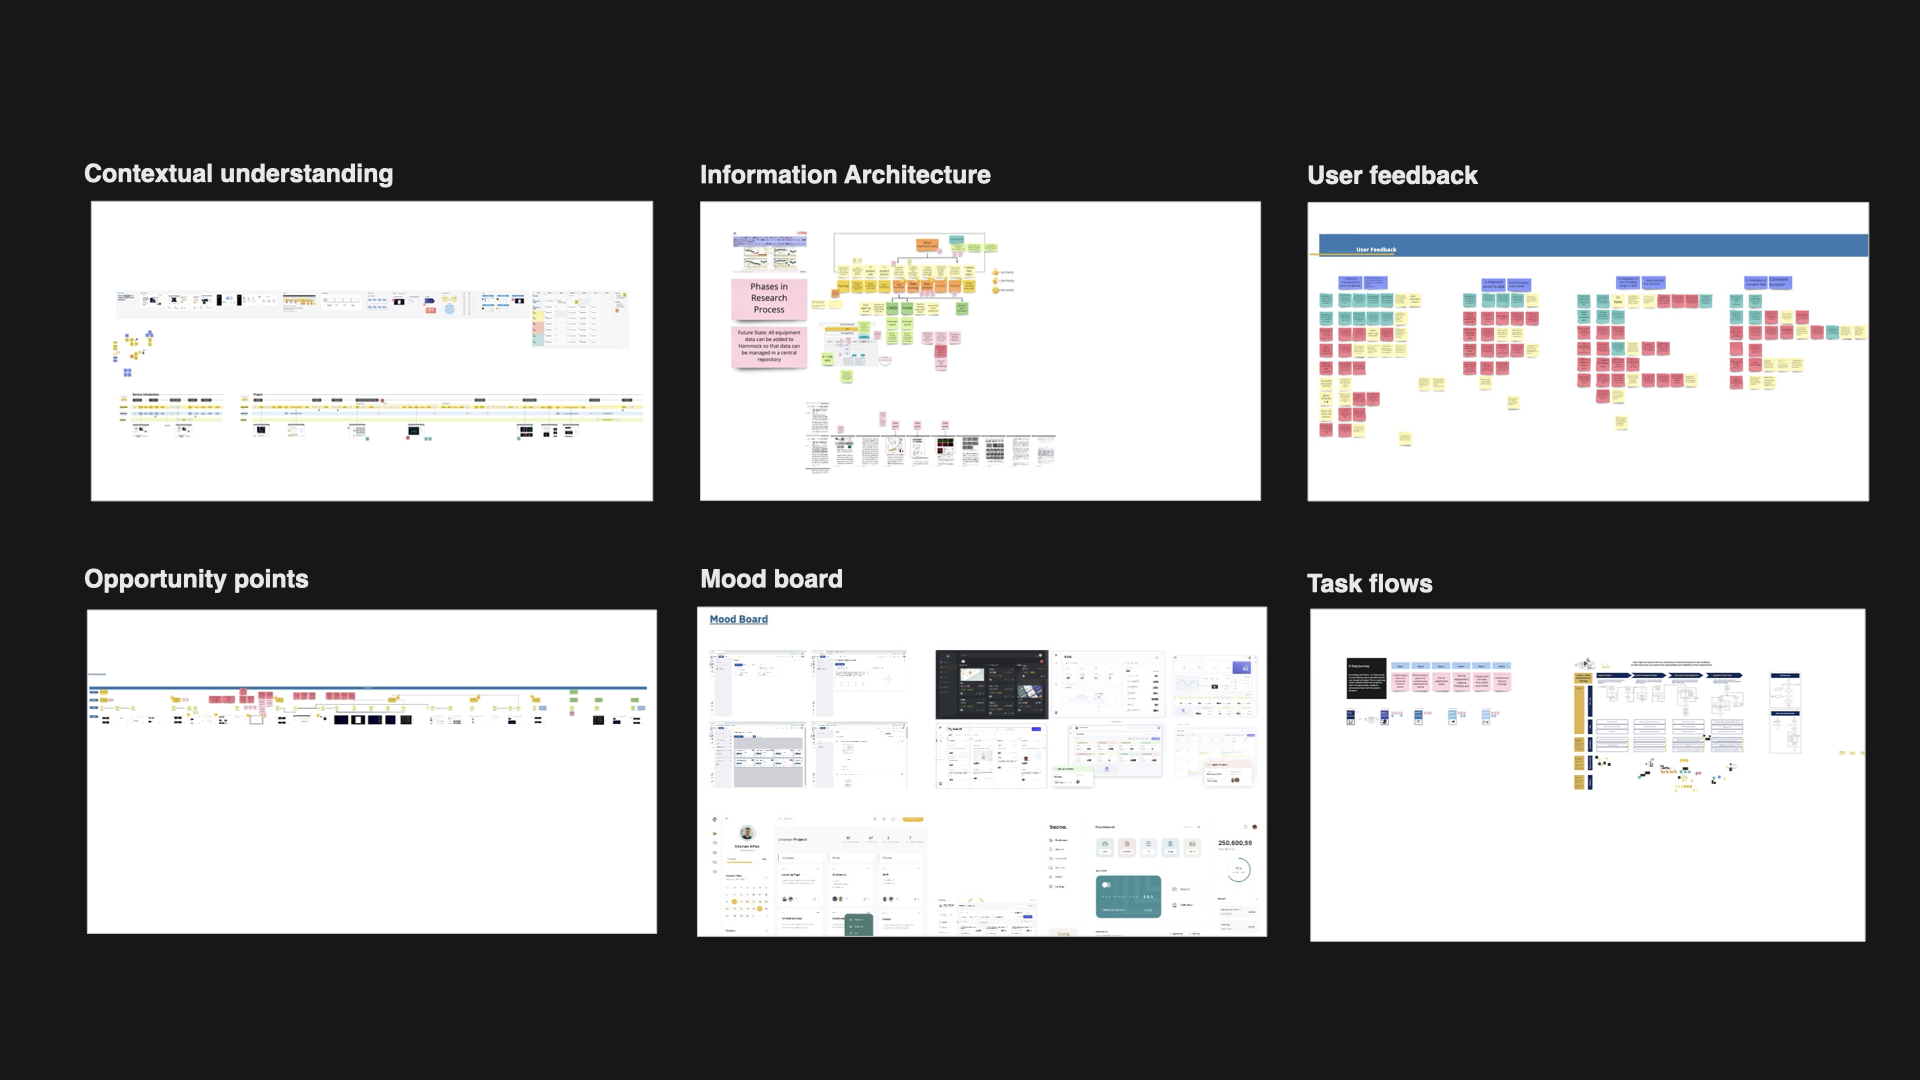
During the discovery phase of the project, we sifted through the previous user test done by the company. As the feedback was in Japanese, we translated the text and synthesised the feedback to pain point themes and opportunities. Through remote collaborative alignment sessions with the client, we validated our findings and narrowed our opportunities to six themes.

Access

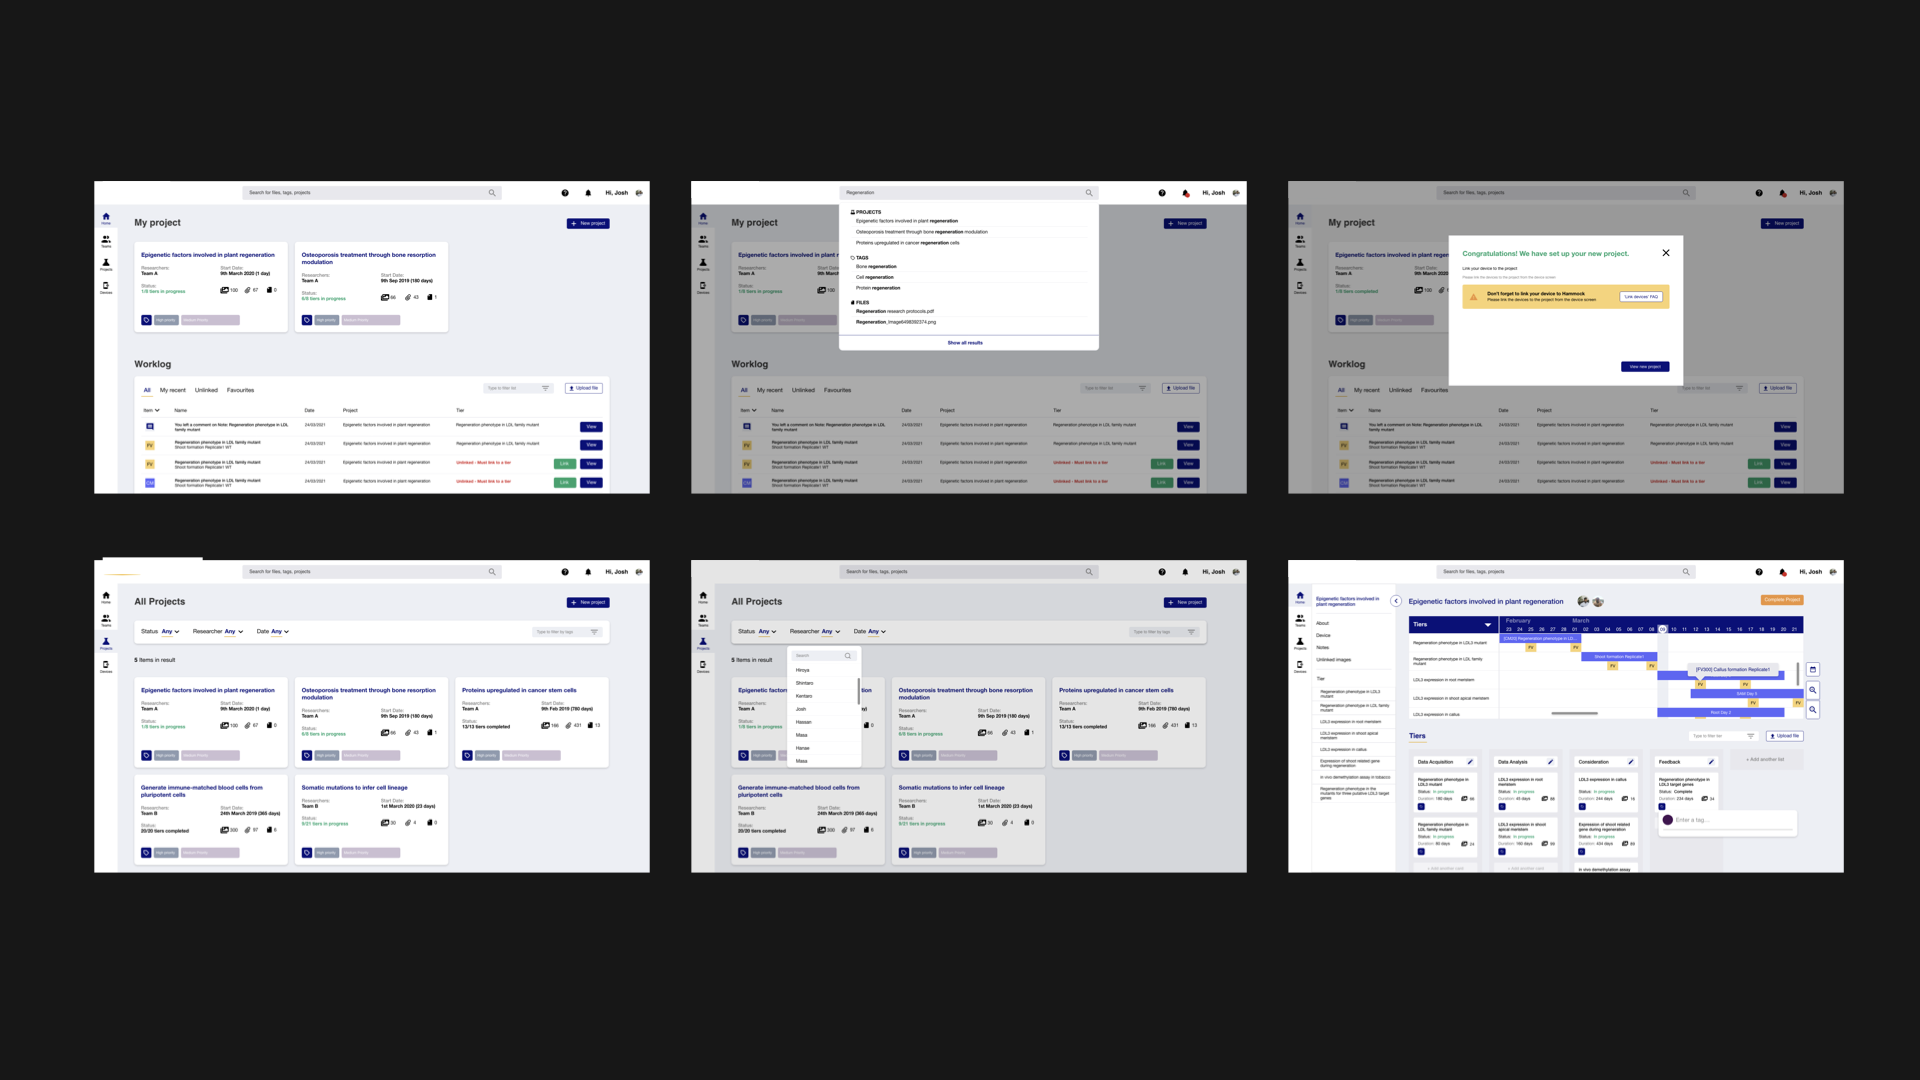
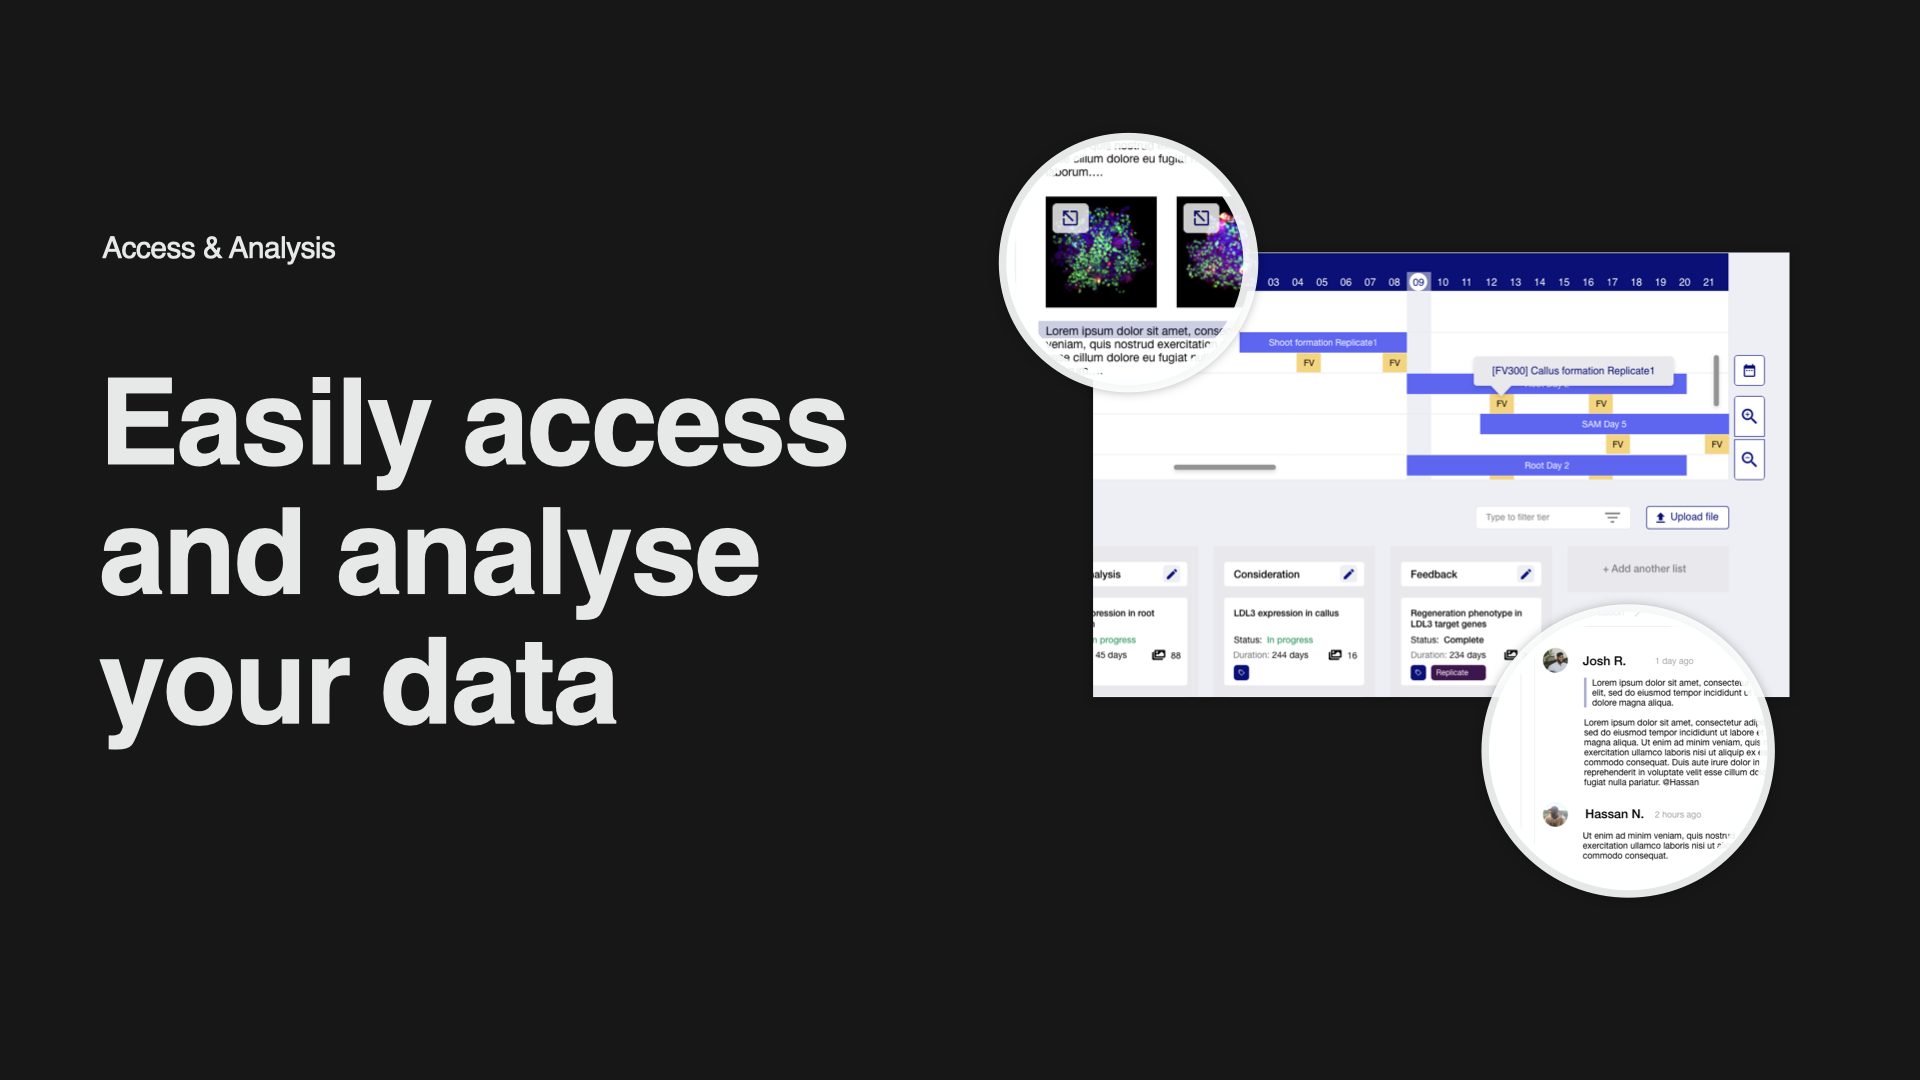
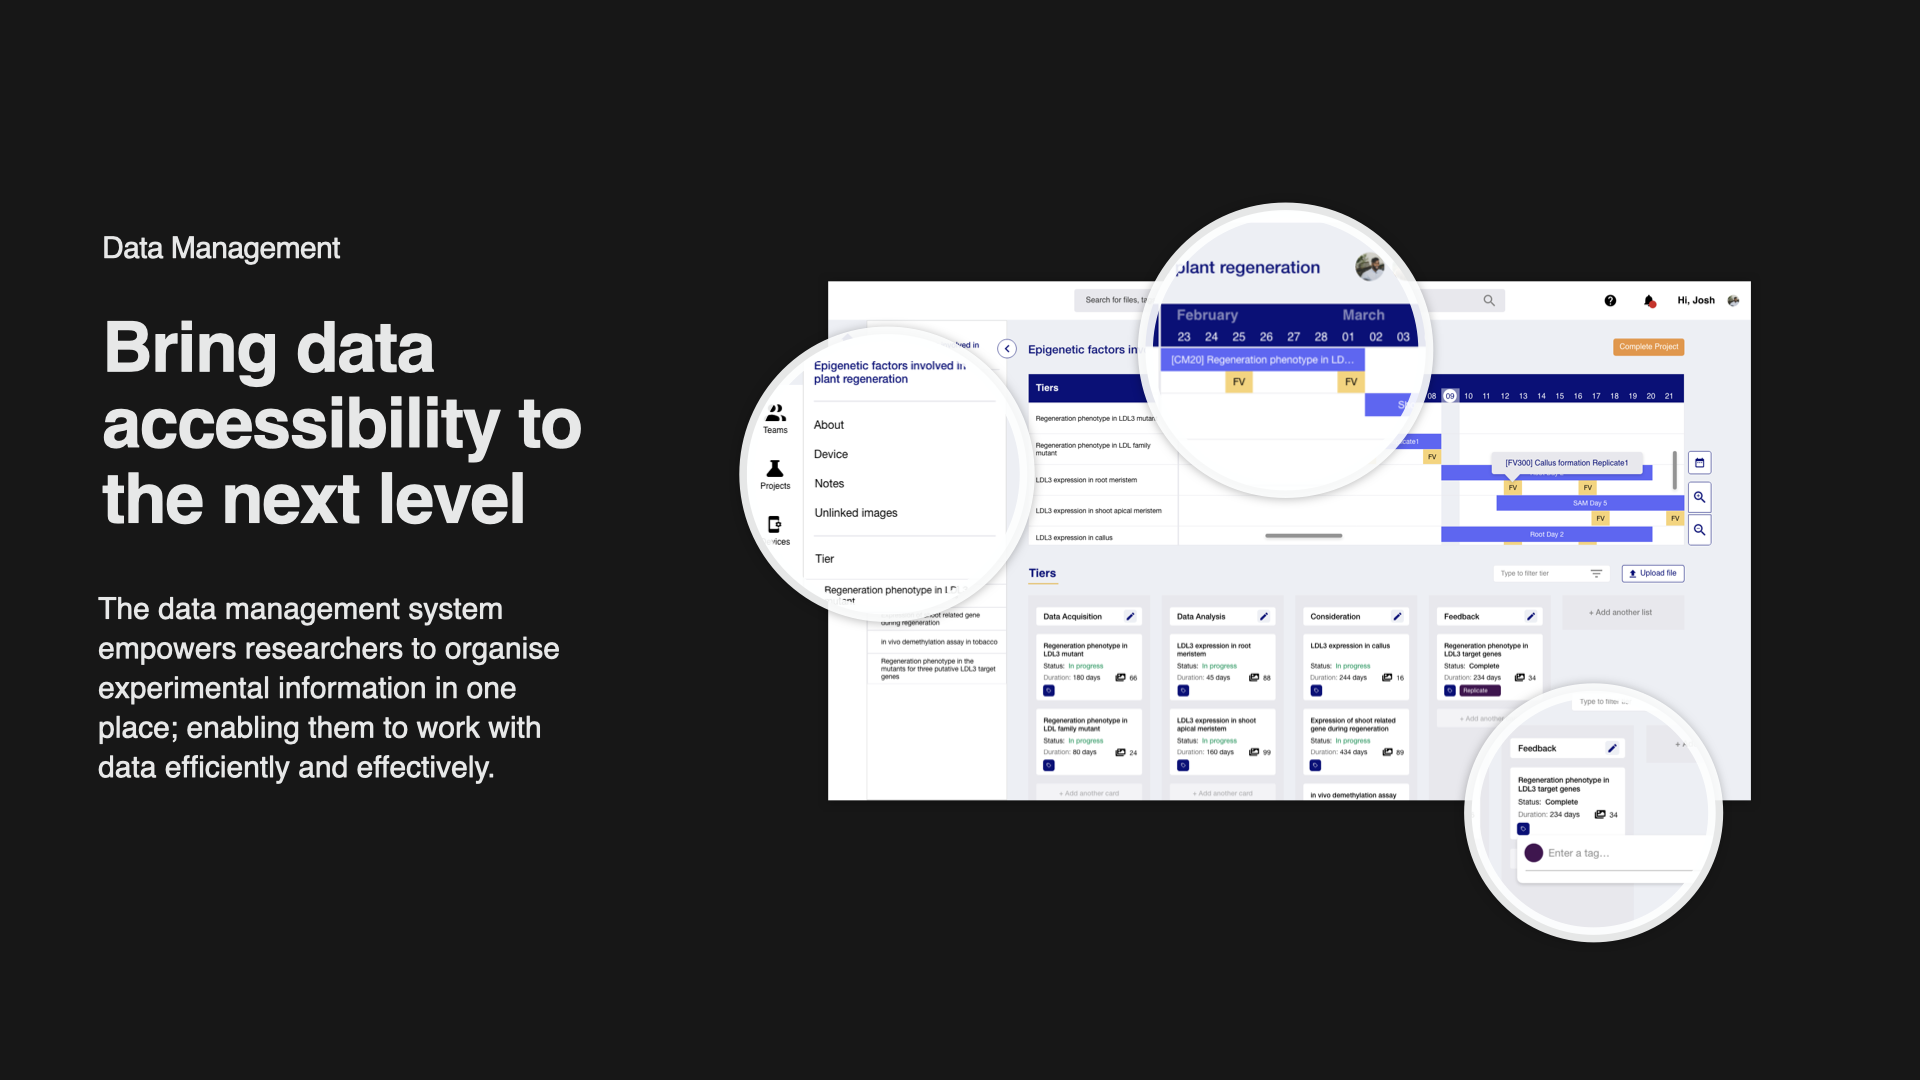
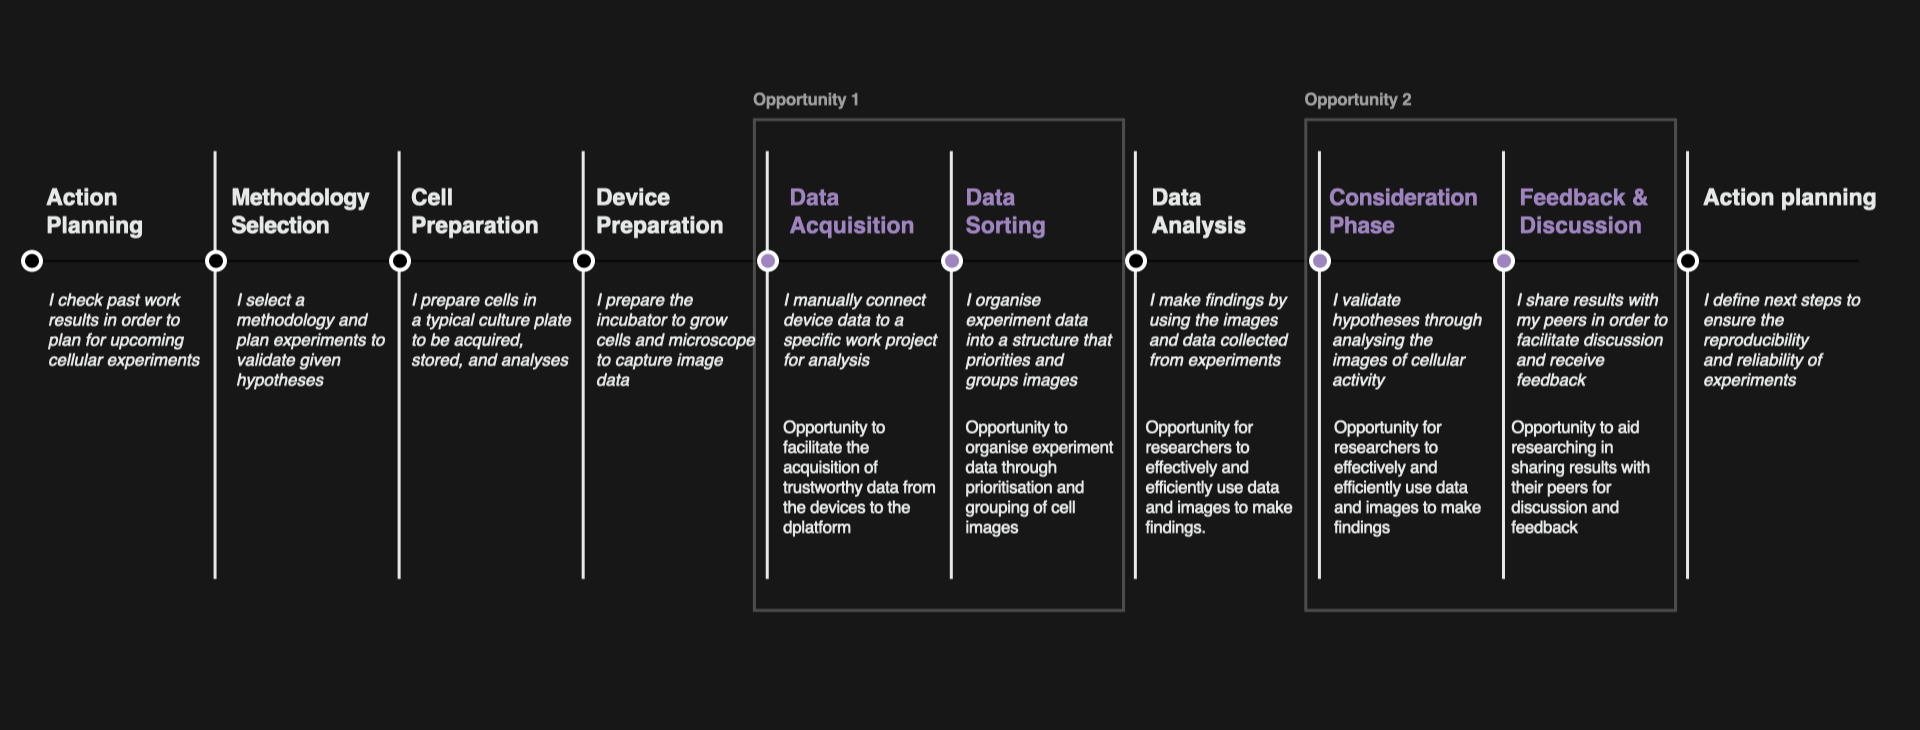
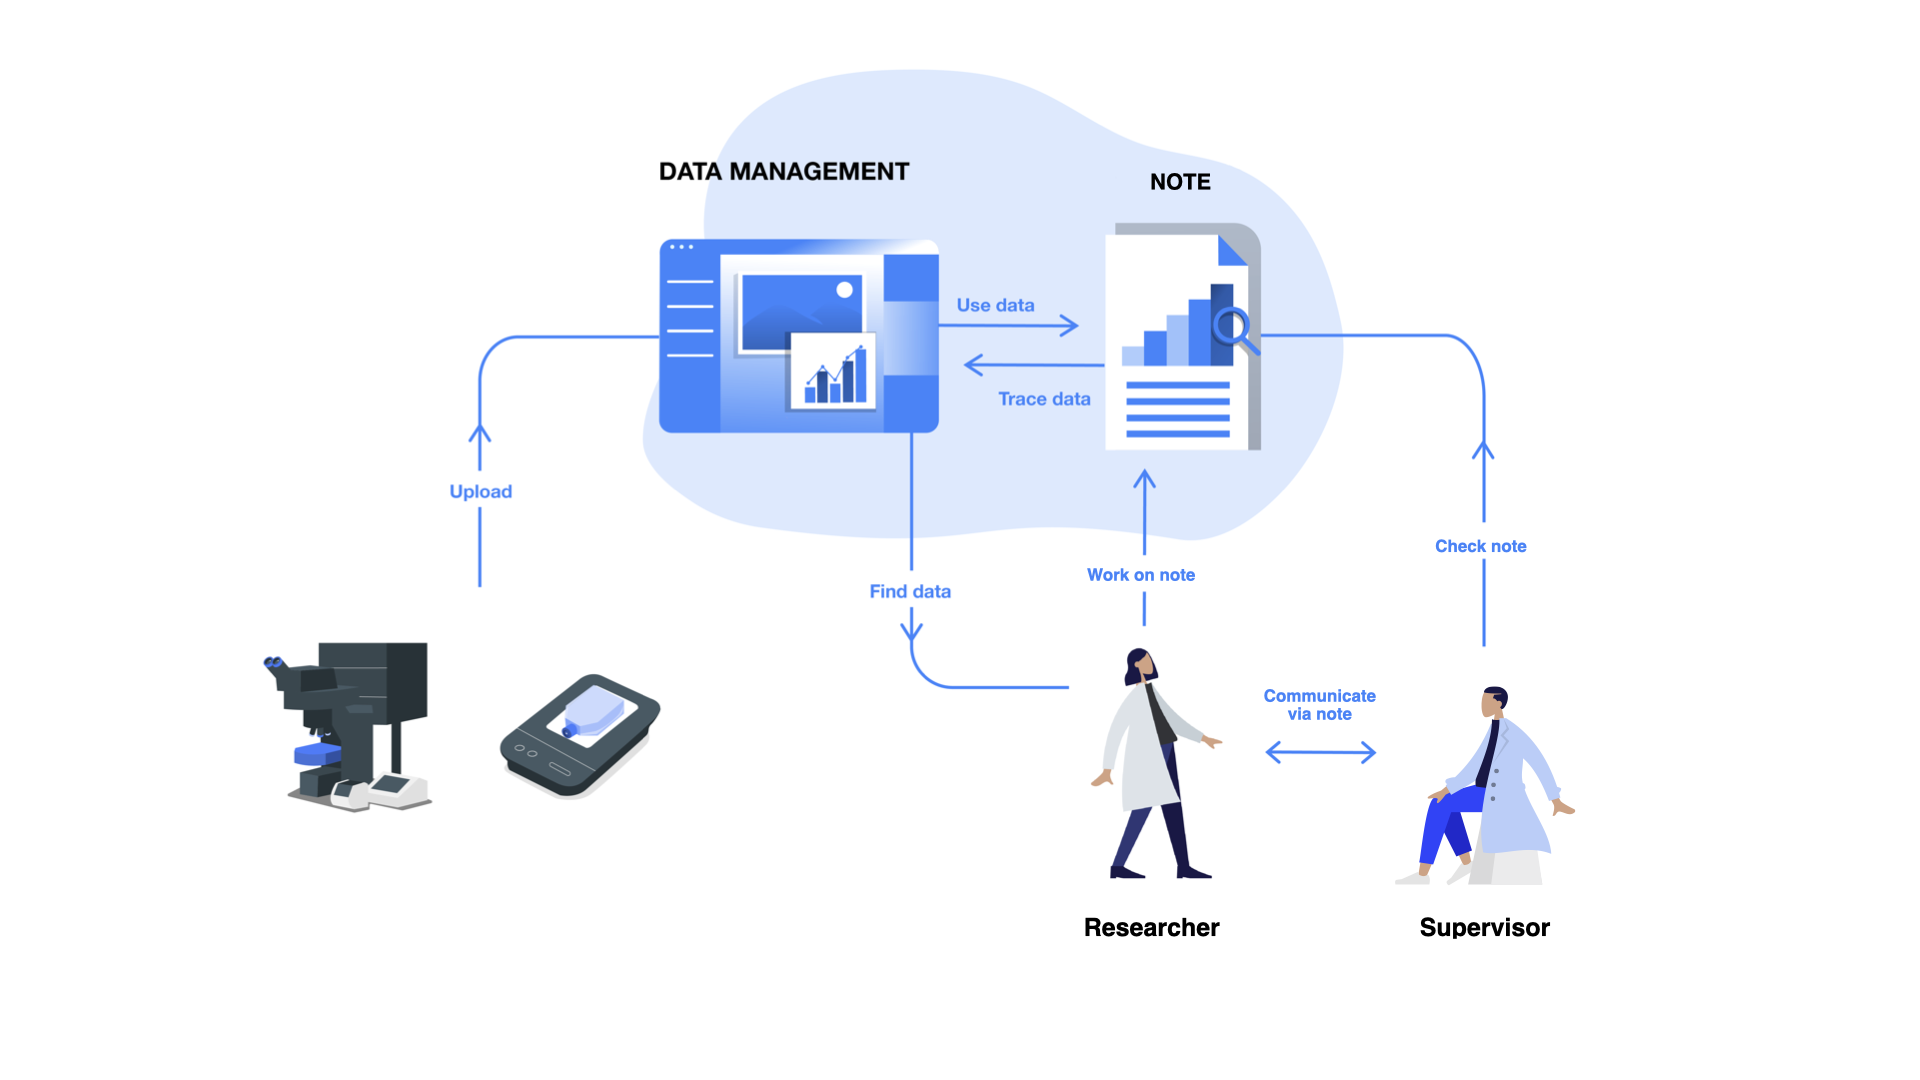
Provide the path of least resistance for users to search, locate, and access experimental data for past and present work

Analysis

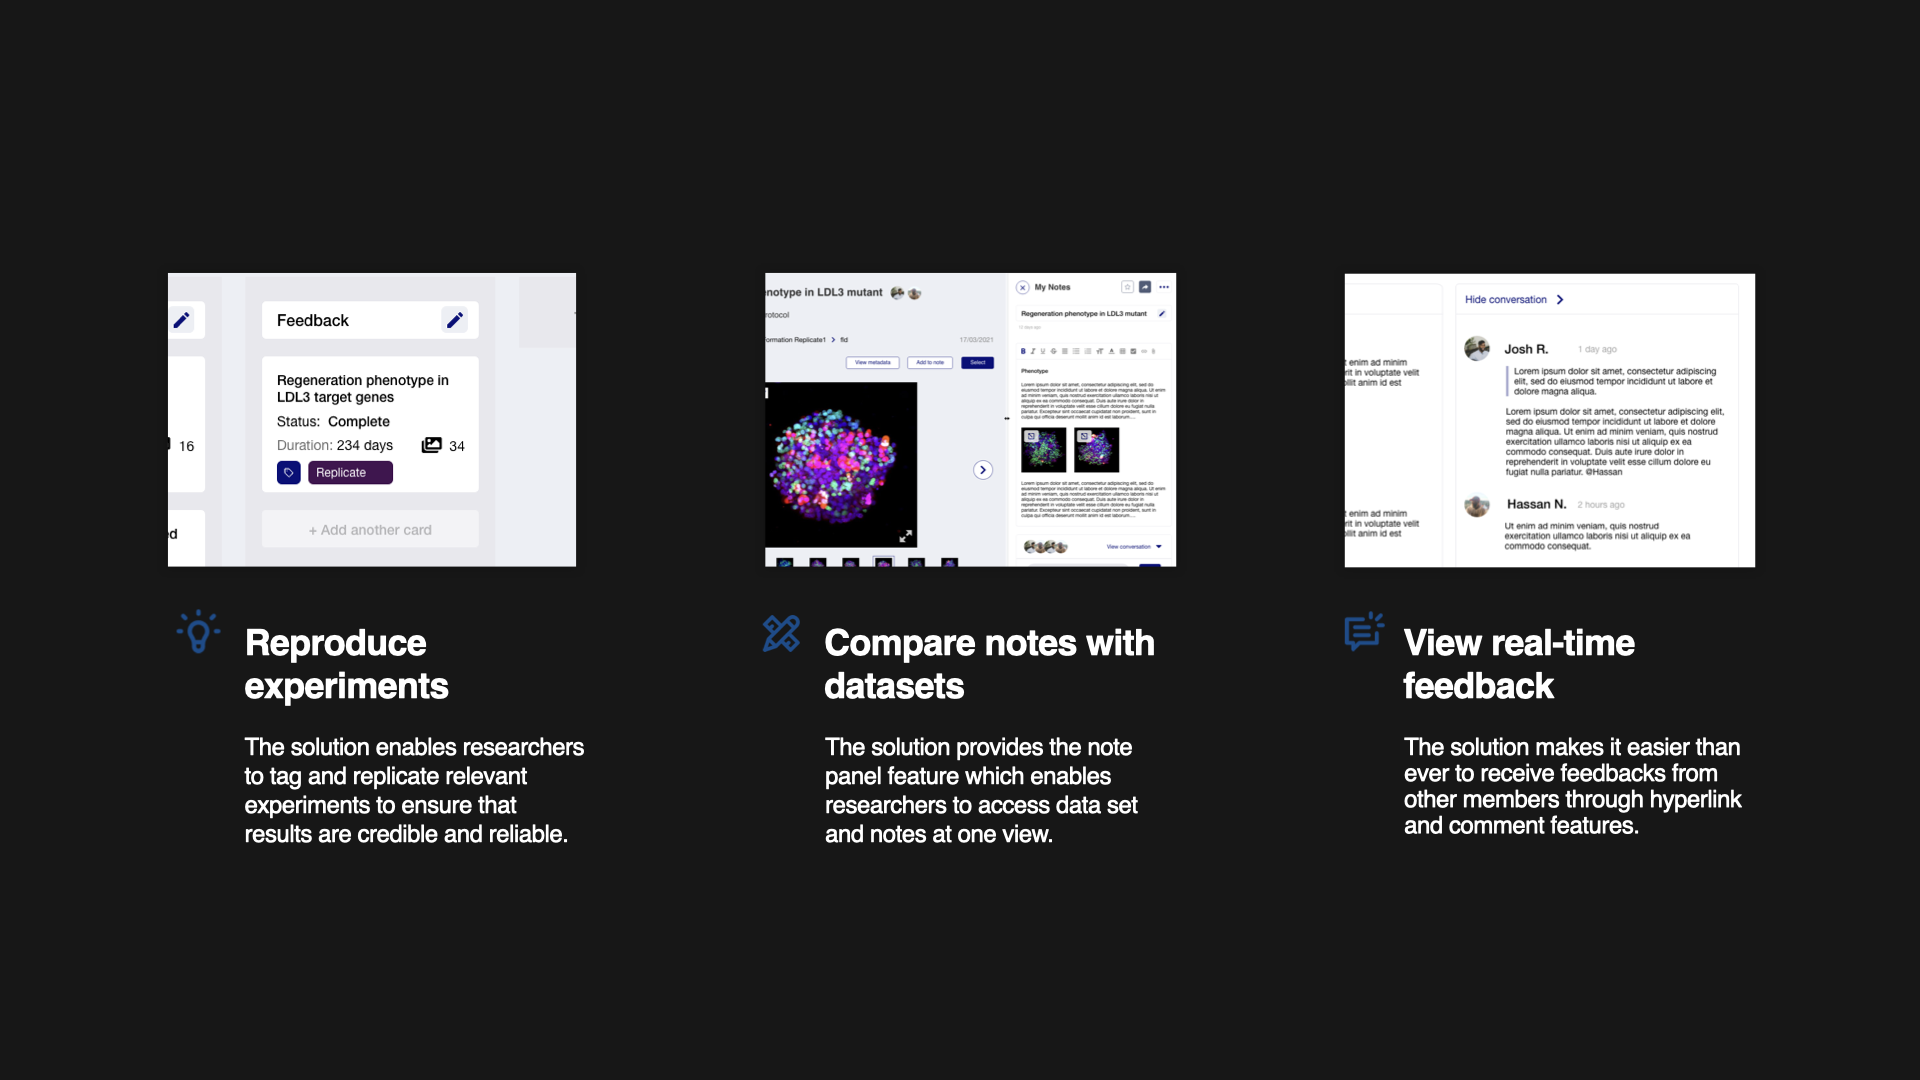
Design a platform for science researchers to document note worthy findings and easily analyse images

Reliability

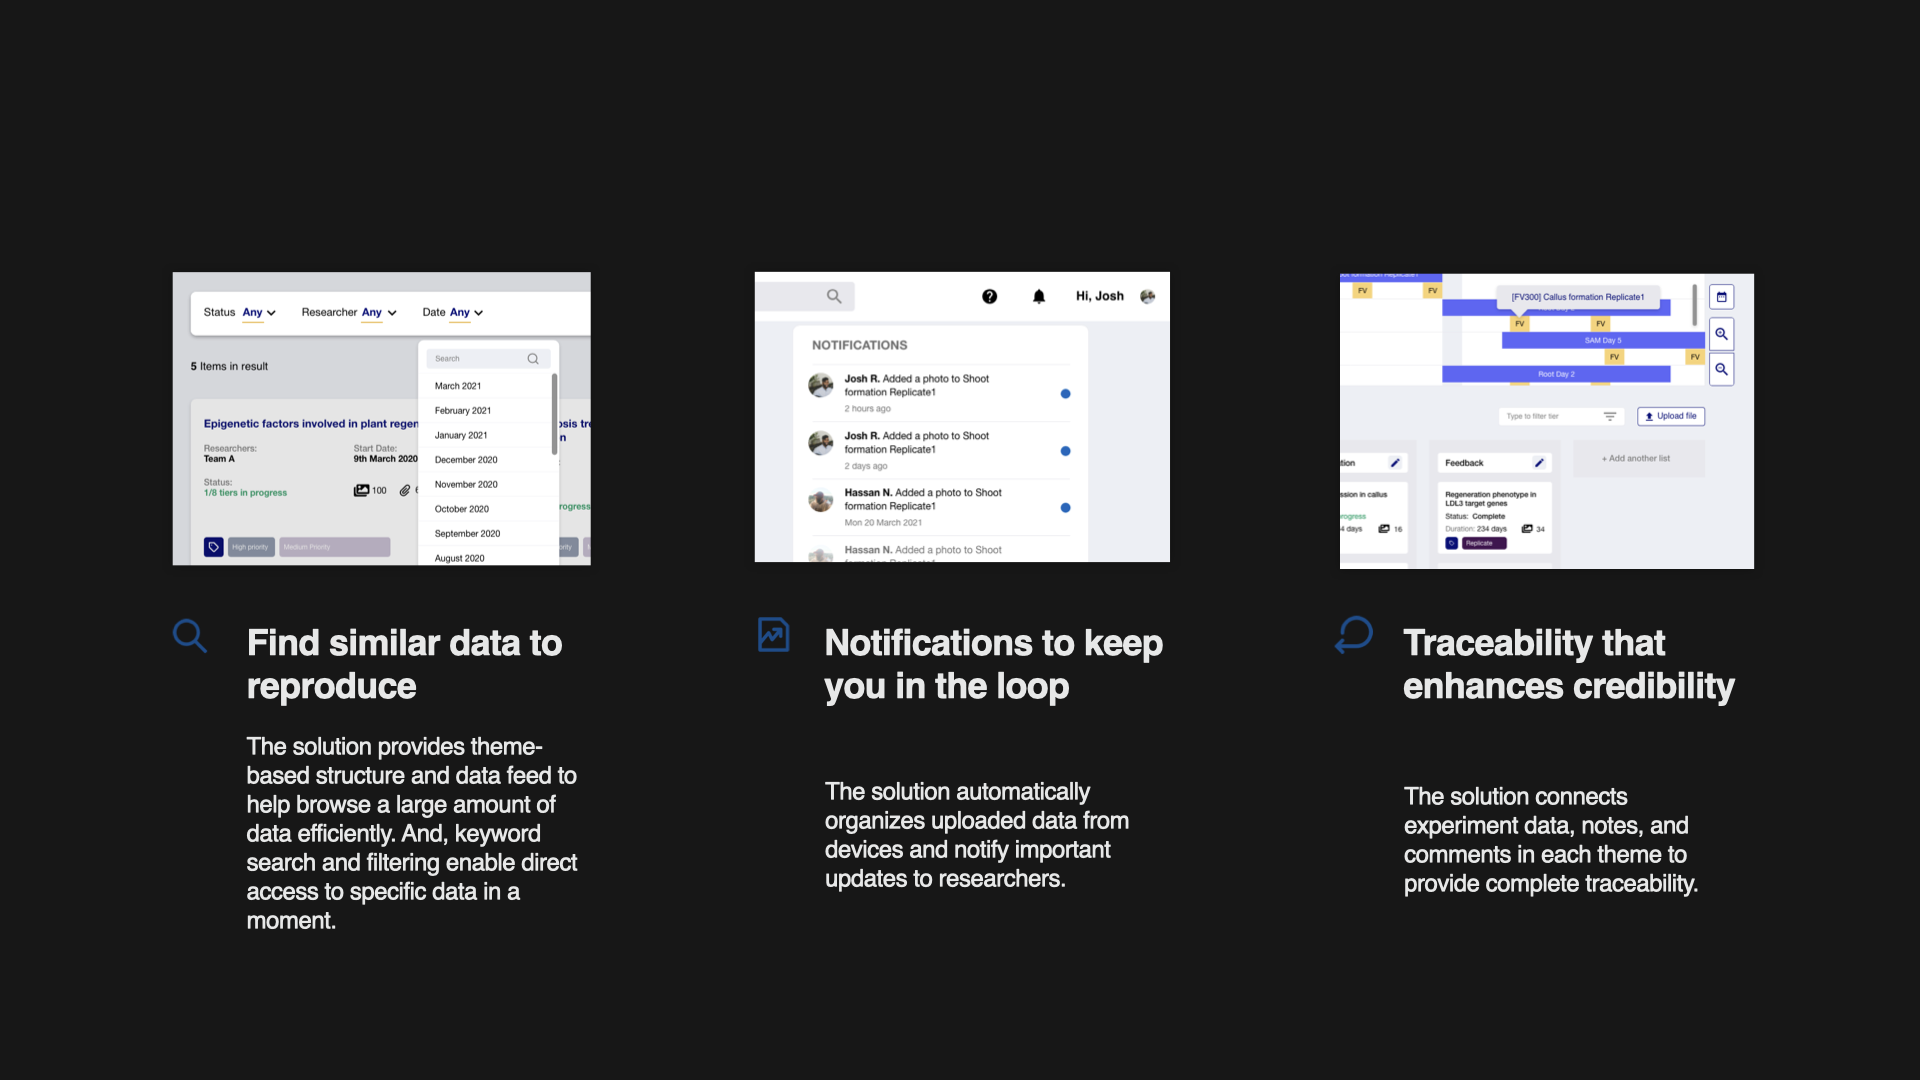
Improve the reliability of experimental data by making it easy to search for similar experiments, data, and notes

Collaborate

Provide a space for science researchers to work together to validate hypotheses 

Data Management

Improve users ability to efficiently manage data, find experiments by date, utilise metadata, use tags, and create work

Communicate

Document communication and make it easy to find comments that enhance the analysis of cellular data 

Below is a visual of the remote work completed during the discovery phase.
During the discovery phase, we spent a lot of time defining the IA and the flow of a project to better understand the researchers requirement of flexibility.

Regarding the IA, there are many tiers involved with a project, and within the tiers, there are different sections and stages as demonstrated in the graphic below. Defining the IA is a significant step to ensuring we design the solution with ...


We ensured we captured the essence of the project as guiding users through a flow of a solution is an important principle to me. The ultimate aim is to make the solution feel natural within the workflow of scientists.
Task flow...

We ensured we captured the essence of the project as guiding users through a flow of a solution is an important principle to me. The ultimate aim is to make the solution feel natural within the workflow of scientists.

Design

During the design loops, we ideated concepts with hand drawn sketches to formalise our concepts and validated our wireframes with the client upon completion of the low, mid and high fidelity designs. The platform allowed the users to connect the devices to the dashboard, which would send data for the researchers to manage. They will then create a project based on the IA, and easily move images and data to the correct stage of the project, where they can favourite and share images, and begin collating their thoughts and observations within the notes panel. There is also a communication function where they can leave comments on photos, tag colleagues and share their notes with their supervisor for feedback and validation.

By digitally tracking experiments, comments, discussions and notes, it allows a laboratories knowledge base to have a digital presence rather than it being held within a senior researcher that could have barriers to accessing that person.

Handover

Along with the solution, the client required us to deliver a "rule book" which is a graphic of how the solution works in the ecosystem and with the users, along with a style guide of the solution. I defined the elements within the style guide and we presented them to the client which was easy for their design team to understand.

Value proposition